
Executive Summary
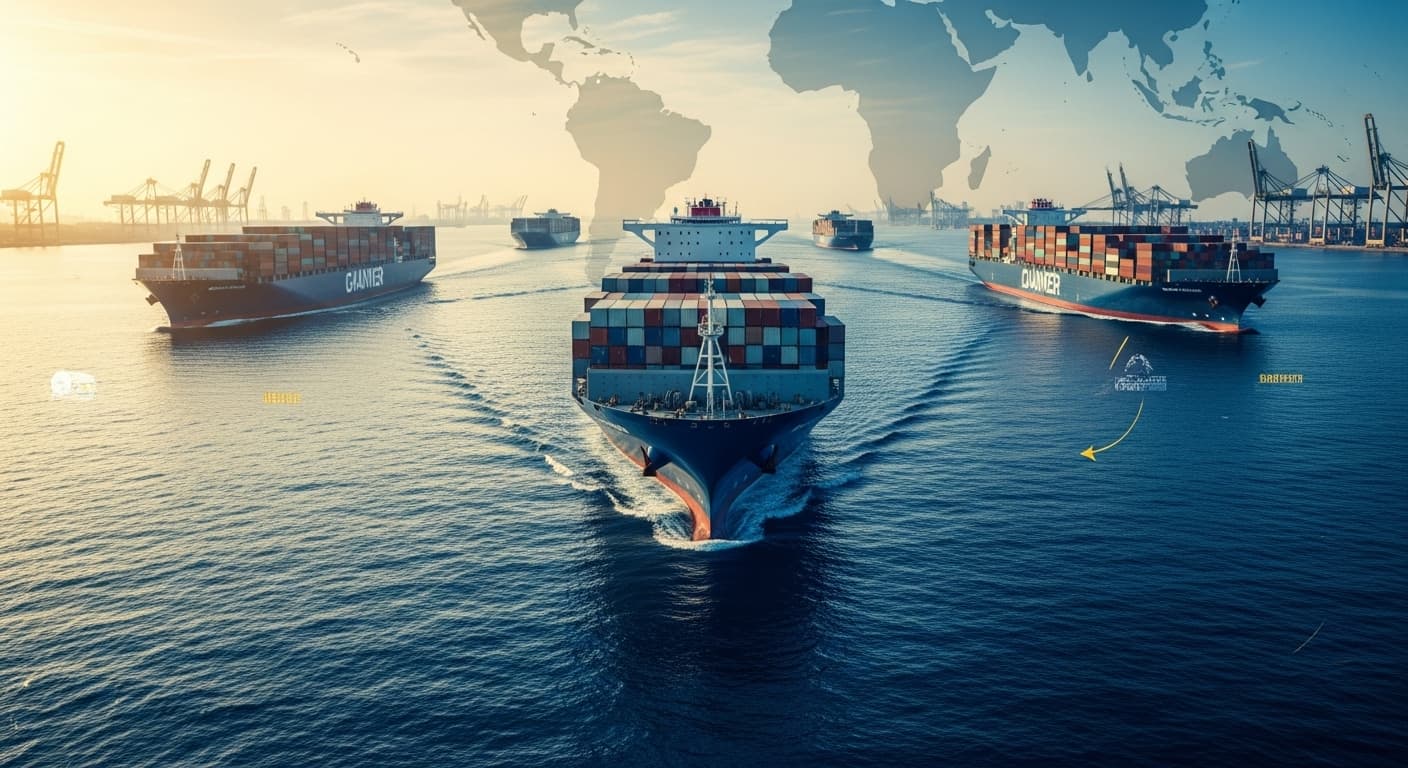
Global shipping is not short of ships; a growing share of them are waiting. C.H. Robinson’s October Edge Report (published October 1, 2026) estimates that roughly 12% of global container ship capacity is absorbed by port congestion—the highest level in four years—with outsized effects in East Asia, Northern Europe, and the Indian Subcontinent. Xeneta’s September scorecard shows schedule reliability at 27% on time, the fourth monthly decline, with an average delay of six days; Far East–Europe reliability fell to 4%. Different trackers measure congestion and reliability differently, and conditions at individual ports are shifting: Shanghai has improved while Singapore has worsened. The common thread is the distinction between headline capacity and usable capacity. This analysis summarizes the data, the regional picture, the causes Drewry and others identify, and planning considerations for logistics providers.
Port Congestion and Usable Capacity: What the 12% Figure Means for Container Shipping
(港口拥堵与可用运力:12%这一数字意味着什么)
1 · The Headline Figure and How to Read It
What C.H. Robinson Reported
In its October Edge Report, C.H. Robinson states that port congestion is absorbing roughly 12% of global vessel capacity, a four-year high, with significant impacts across East Asia, Northern Europe, and the Indian Subcontinent. The company’s framing is the central idea of this article: “Capacity may exist in the ocean network, but port congestion and steps the carriers are taking to get schedules back on track can change where and when that capacity is actually available.” Elsewhere in the report it describes the picture as “increasingly one of usable capacity rather than headline fleet capacity.”
The 12% does not measure ships that do not exist. It measures vessels that are afloat but not available to move cargo on schedule because they are waiting for berths or caught in disrupted rotations.
Different Trackers, Different Numbers
Congestion estimates vary with each tracker’s methodology, so figures should be compared within a source rather than across sources:
| Source | Estimate | Timing / Context |
|---|---|---|
| C.H. Robinson (October Edge Report) | ~12% of global capacity; four-year high | Published October 1, 2026 |
| Linerlytica (via C.H. Robinson’s September report) | ~12.6% (about 4.3 million TEU of a 34.4 million TEU fleet) | Late August 2026 |
| Linerlytica (as reported by The Loadstar) | 3.92 million TEU, about 11% of the fleet | September 1, 2026 |
| Sea-Intelligence | ~8.5% of global capacity tied up by the summer typhoon disruption | Reported in September 2026 |
| Linerlytica, 2022 peak (for comparison) | ~15.7% of a 25.3 million TEU fleet | 2022 |
Why This Matters: in absolute terms, more than 4 million TEU of capacity has been waiting to berth—more than at the pandemic-era peak, according to industry reporting—but because the fleet is larger today, the share of capacity affected is below the 2022 peak. “Four-year high” is an accurate description of the recent level; it is not the highest on record as a percentage. The estimates have also been broadly flat between late August and early October rather than rising steadily, even as conditions at individual ports changed.
2 · The Regional Picture
East Asia: Shifting Rather Than Disappearing
East Asia remains the main source of congestion, following a series of typhoons between July and early September that closed major ports. Recent data show an uneven recovery:
| Port | Recent Indicator | Source / Timing |
|---|---|---|
| Shanghai | Average daily anchorage queue fell from 101 to 86 vessels, but average waits rose from 1.9 to 2.7 days | Xeneta, September |
| Shanghai | 7-day average vessel wait about 2.6 days; congestion “improved across terminals” | Kuehne+Nagel, October 7–13 |
| Shanghai and Ningbo | 136 vessels waiting, almost 860,000 TEU caught up in congestion | Drewry, October 8 |
| Singapore | Average daily queue rose from 12 to 22 vessels; waits rose from 1.9 to 3.1 days | Xeneta, September |
| Singapore | Berth waits of 3–5 days, longer for vessels carrying large transshipment volumes | Kuehne+Nagel, October 7–13 |
Sea-Intelligence data cited in trade reporting show Shanghai’s arrival-to-berth waits falling from 137 hours in mid-August to 69 hours by September 28. At the same time, Singapore, Qingdao, and Port Klang continue to show elevated queues.
Singapore’s role as the world’s largest transshipment hub is why its congestion matters beyond local traffic: delays there can cascade across multiple trade lanes, including for cargo that is not destined for Singapore.
Elsewhere
- Southeast Asia: average waits of about two days, with 23% of vessels waiting (Xeneta, September).
- Africa: the most congested region by average wait (2.5 days in September), although waits fell by almost a day.
- Northern Europe and the Indian Subcontinent: named by C.H. Robinson as significantly affected. Maersk’s CEO said on the company’s August 13 financial presentation that container port capacity was insufficient and contributing to congestion in Europe, the East Coast of South America, West Africa, and the Middle East amid strong export growth from Asia.
Network Effects
Congestion travels along rotations. Typhoon closures prompted some carriers to omit port calls, while congestion at transshipment hubs caused missed connections and longer cargo backlogs. Containers waiting at congested terminals also complicate the repositioning of empty equipment.
⚠️ Key Point: Congestion is a network issue rather than a single-port issue. A delay at one hub can affect connections, equipment, and arrival times several ports away.
3 · Schedule Reliability
Xeneta’s September Scorecard
Global container schedule reliability fell for the fourth consecutive month to 27% on time in September, down two percentage points from August and matching February’s low. Average delay reached six days, up 2.4 days since the start of the second quarter.
| Trade Lane | On Time (Sept. 2026) | Average Delay |
|---|---|---|
| Far East–Europe | 4% | 9.9 days |
| Far East–North America | 20% | 6.9 days |
| Europe–North America | 49% | 1.9 days |
| Global | 27% | 6.0 days |
Source: Xeneta Schedule Reliability Scorecard, September 2026
Far East–Europe recorded its weakest performance since September 2021, when 3% of arrivals were on time. Europe–North America improved by eight percentage points to its highest level since August 2025. South America’s West Coast and East Coast trades also improved.
Carriers and Alliances
Every carrier Xeneta tracks posted its highest average delay in 12 months. Four reached 12-month lows in on-time arrivals: CMA CGM (30%), COSCO (18%), Hapag-Lloyd (45%), and Yang Ming (4%). Maersk, the most reliable carrier, fell from 51% to 47%. The Gemini network of Maersk and Hapag-Lloyd declined from 70% on time in June to 40% in September, and Xeneta’s weekly data put it at 34% for the week ended September 28.
Reading Reliability Figures Carefully
Trackers define “on time” differently. Sea-Intelligence, for example, reported global on-time arrivals of about 49.9% for August, with Asian ports around 32%, compared with Xeneta’s 29% for the same month. The direction of travel is consistent across sources; the levels are not directly comparable.
Vessel Bunching
Delays also cause vessels to arrive in clusters. Drewry notes that delays to certain sailings can cause vessels to bunch at subsequent ports, which can overwhelm yard capacity and inland connections.
Capacity Management Continues
Xeneta reports that announced October cancellations represent at least 17% of planned Far East–Europe capacity and 13% of Far East–North America capacity. At the same time, planned Far East–Europe capacity for October is the highest in 22 months, and Far East–North America ranks third-highest—so scheduled capacity is not scarce even as reliability is low. Xeneta does not expect a firm floor for reliability in October.
4 · Port Omissions and Blank Sailings
Why the Difference Matters
C.H. Robinson highlights a distinction that matters for planning: port omissions can be more disruptive than planned blank sailings.
| Factor | Blank Sailing | Port Omission |
|---|---|---|
| Timing of notice | Announced in advance | Occurs after the voyage is underway |
| Shipper planning | Can generally be accounted for before cargo leaves origin | Limited; cargo may wait for a feeder, move through another hub, or be recovered through an alternative service |
The Golden Week Period
Blank sailings around China’s Golden Week (October 1–7) reduce effective capacity into mid-October, and C.H. Robinson notes that the first departures after the holiday can face rollover risk as factories restart. Early indications are mixed: Drewry’s World Container Index fell 2% in the week to October 8 as Golden Week softened demand, while C.H. Robinson observes that a strong cargo rebound could keep preferred sailings full and a weaker one could let space normalize later in October.
⚠️ Key Point: Because omissions can happen mid-voyage, planning for them means building recovery options into routings rather than relying on advance notice.
5 · Why Congestion Persists
C.H. Robinson lists several contributing factors: congestion itself, vessel bunching, typhoons, conditions in the Middle East, and Panama Canal restrictions. Drewry adds a structural view.
Volume Has Grown Faster Than Capacity
Drewry’s analysis of nine major container ports finds that terminal capacity grew an average of 21% between 2019 and 2026, while container volumes grew 28%. Across the same period, the global average for ship waiting times nearly doubled (comparing the first seven months of 2019 and 2026), and average time spent in port rose 31%, with a growing share of that time spent waiting for a berth.
Utilization and Recovery Time
Drewry also points out that high berth utilization reduces resilience: a terminal running at 90% berth utilization takes roughly one week to recover from a one-day disruption, while one at 75% utilization can recover in about two days. In early August, typhoons in China pushed average berth waits to 3.6 days (Drewry, week 32).
Who Is Responsible?
Drewry does not see a single global trend toward under-investment in port capacity; it describes a stronger focus on asset utilization across the system. It also notes that carrier practices—blank sailings, ad hoc sailings, and extra loaders—can create sharp peaks in vessel arrivals that contribute to yard congestion and berth delays. Maersk’s CEO, by contrast, has pointed to insufficient port capacity relative to export growth in several regions. The two views are not mutually exclusive.
The Typhoon Sequence
Successive typhoons between July and early September closed or disrupted major Asian ports. Linerlytica and APL Logistics counted several storms (including Dolphin and Saudel), and by September 1, ships were reported waiting about 10 days to berth at Shanghai and Ningbo. Xeneta notes that disruption of this kind can continue to erode reliability months afterward and far from where it began.
6 · Planning Considerations for Logistics Providers
Headline Capacity Versus Usable Capacity
C.H. Robinson identifies four factors as increasingly important in whether capacity is actually usable: port selection, dependence on transshipment, container availability, and the ability to recover from a missed connection. The table below shows how these can inform planning:
| Traditional Focus | Usable-Capacity Focus |
|---|---|
| Scheduled capacity on a lane | Capacity not tied up in congestion or disrupted rotations |
| Published transit times | Delay probabilities and rollover risk |
| Announced blank sailings | Port omissions and missed connections |
| Rate comparison | Port selection and recovery capability alongside rate |
Port and Routing Choices
Where congestion is concentrated, port selection becomes a planning variable. Considerations include the trade-off between longer inland transit and shorter port waits, and the extent to which a routing depends on transshipment hubs that are experiencing delays.
Equipment Availability
Containers waiting at congested terminals can delay empty repositioning, which can create equipment imbalances. Early commitments and awareness of equipment availability at origin and destination can reduce exposure.
Inland Effects
C.H. Robinson’s drayage outlook notes that bunched arrivals can tighten appointments, chassis, and drayage capacity for short periods even when overall truck supply is adequate. The signal it highlights for October is the time between vessel discharge or rail arrival and when a container can realistically be recovered.
Carrier Evaluation
Reliability data and recovery capability can sit alongside price when comparing carriers. Xeneta suggests that shippers scrutinize reliability, capacity cuts, and service commitments in contract negotiations.
Indicators Worth Tracking
| Metric | Example Sources | What It Indicates |
|---|---|---|
| Schedule reliability and delay | Xeneta, Sea-Intelligence | Overall network health |
| Vessels waiting / berth wait times | Drewry, Kuehne+Nagel, Linerlytica | Port-level congestion |
| Announced blank sailings | Xeneta, Drewry | Capacity management |
| Port omissions and rotation changes | Carrier advisories | Unplanned disruption |
| Container availability | Carriers, lessors | Equipment balance |
7 · Conclusion: Capacity That Is Available Versus Capacity That Is Usable
Key Takeaways
| Factor | Detail |
|---|---|
| Capacity absorbed by congestion | ~12% (C.H. Robinson, October); estimates vary by tracker |
| Schedule reliability | 27% on time in September (Xeneta); trackers define “on time” differently |
| Average delay | 6.0 days globally; Far East–Europe 9.9 days |
| Regional picture | Shanghai improved; Singapore worsened; Shanghai/Ningbo still show 136 vessels waiting (Drewry, Oct. 8) |
| Structural factors | Terminal capacity +21% vs. volumes +28% (nine ports); high berth utilization |
| Disruption type | Port omissions can be harder to plan for than blank sailings |
The Takeaway
The data point to a market where capacity on paper is ample but reliability is low, and where congestion is moving between hubs rather than disappearing. For shippers and logistics providers, the useful frame is the one C.H. Robinson offers: look at whether capacity is usable—by port, by routing, by equipment, and by a carrier’s ability to recover when connections break—rather than at fleet size alone.
If your organization would like help reviewing routing options or contingency approaches for ocean freight, our logistics team is available.
This analysis reflects C.H. Robinson’s October 2026 Edge Report (published October 1, 2026), Xeneta’s September 2026 Schedule Reliability Scorecard, Drewry’s Market Signals and World Container Index commentary (August–October 2026), Sea-Intelligence and Linerlytica estimates as reported in trade press, and Kuehne+Nagel port updates for October 7–13, 2026. Congestion and reliability estimates differ by methodology and change quickly; readers should consult current data from carriers and trackers for planning.