Executive Summary
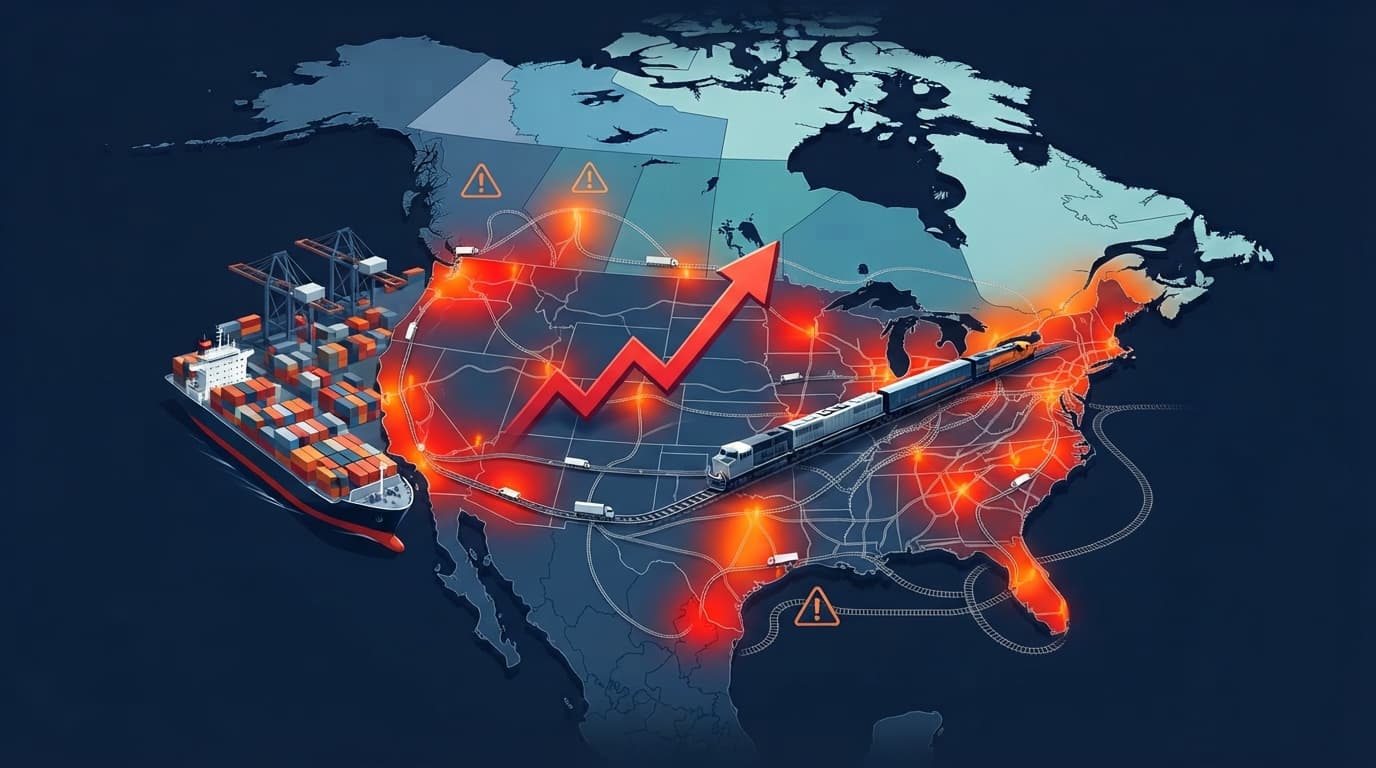
The North American logistics market in July 2026 is defined by significant capacity tightening across truckload networks, record import volumes at U.S. ports, accelerating intermodal adoption, and mounting cross-border trade uncertainty following the U.S. decision not to renew the USMCA in its current form. Spot truckload rates have surged to levels not seen since 2022, while U.S. ports are handling historic import volumes driven by tariff front-loading ahead of anticipated policy changes. Intermodal volumes are consistently tracking above the five-year average as shippers seek cost relief from rising truckload costs. This analysis examines market dynamics across major transportation modes and offers context for navigating this complex environment.
North America Logistics Market: Capacity, Rates, and Strategic Considerations for Mid-2026
(2026年北美物流市场:运力、费率与战略考量)
1 · Market Overview: A Market in Transition
The North American logistics landscape in July 2026 presents a complex picture of tightening capacity, rising costs, shifting trade patterns, and evolving regulatory uncertainty. After several years of relative stability followed by a prolonged downturn, the market shows clear signs of structural change affecting shippers, carriers, and logistics providers alike.
The Capacity Tightening Narrative
Structural Supply Constraints: The most significant development in the North American truckload market is the sustained tightening of carrier capacity. After years of excess capacity that kept rates subdued, the market has reached an inflection point. Carrier authority counts have returned to historical levels, reducing the excess slack previously available.
This tightening reflects multiple converging factors: ongoing barriers to entry for new carriers, limited fleet expansion, and regulatory pressures removing less reputable operators from the market. The impact has been most visible during disruptive events such as Roadcheck Week, where rates spiked much higher than historical averages—a signal that the market no longer has the buffer capacity that once absorbed such shocks.
Spot Rate Acceleration: The tightening supply-demand balance has translated directly into rate increases. Industry forecasts point to substantial year-over-year increases in dry van and refrigerated van cost per mile for 2026, reflecting both elevated realized costs and a higher baseline entering the summer period.
Aggregate spot rates rose to above 50% year-over-year at the beginning of July, according to freight data providers. The national average van truckload spot rate exceeded the contract rate in June for the first time since February 2022, with overall rate growth far exceeding volume growth. This inversion—spot rates surpassing contract rates—is a strong indicator of a tightening market and typically precedes upward pressure on contract rates.
Route Guide Performance Deterioration
Operational Stress Signals: Route guide depth—a measure of how far shippers must go into backup carrier strategies when preferred carriers reject tenders—has deteriorated significantly. After remaining flat at historically low levels for three years, route guide depth began rising in late 2025 and has remained challenged since.
Long hauls of more than 600 miles have performed worst, indicating supply challenges particularly affecting the carrier base focused on long-distance, over-the-road freight. Geographically, the West continued to be the best-performing region, though even there, conditions are tightening.
2 · Truckload Market: The Epicenter of Tightening
The truckload market represents the most pronounced area of capacity constraint and rate escalation in the current environment.
Carrier Supply Dynamics
Reduced Fleet Expansion: The reduction in carrier supply has been the primary driver of increased truckload rates in 2026. Several structural factors are limiting fleet growth:
Regulatory Pressures: Tighter regulations on truck drivers, including English proficiency requirements, restrictions on non-domiciled commercial driver’s licenses, and enforcement against so-called “zombie truckers,” are removing capacity from the market. Less reputable driver training institutes are being forced out of the business, reducing the pipeline of new entrants.
Economic Barriers: Ongoing barriers to entry and limited fleet expansion remain the primary drivers of rising rates. The cost of equipment, insurance, and driver recruitment continues to rise, making it difficult for new carriers to enter the market and for existing carriers to expand.
Class 8 Truck Orders Surge: In a telling indicator of fleet renewal and expansion efforts, North American Class 8 truck orders continued their remarkable rebound in June 2026, rising substantially year over year. Strong freight demand and looming EPA emissions rules are accelerating purchases. While this suggests future capacity additions, the lag between orders and actual fleet deployment means near-term capacity relief remains limited.
Contract Market Pressure
Renewed Pricing Pressure: The tightening spot market is now exerting significant pressure on contract rates. Route guide failures—when preferred carriers reject freight, sending shipments into the spot market—have increased substantially. This forces shippers to pay higher spot rates for freight they had planned to move under contract, creating budget volatility and operational stress.
Rate Trajectory Ahead: Looking ahead, trucking executives and analysts are forecasting continued rate increases into 2027, with contract rates expected to rise meaningfully and spot rates projected to increase further still. The widening spread between spot and contract rates is creating upward pressure on contract pricing and increasing routing guide disruption.
Less-Than-Truckload (LTL) Implications
Gradual Firming: The LTL market is showing signs of gradual firming as higher truckload prices push more freight back into LTL networks. “Bubble” shipments—those that sit on the margin between LTL and truckload—are increasingly moving back into LTL networks.
While LTL service levels have remained largely consistent through June with no meaningful disruption to service across major carrier networks, carrier discipline and shifting volumes could shape capacity and pricing into the second half of 2026.
3 · Intermodal: Gaining Momentum as a Cost-Effective Alternative
Rising truckload costs are accelerating the shift toward intermodal transportation, with volumes consistently tracking above the five-year average.
Volume Growth and Market Positioning
Strong Demand Indicators: Intermodal freight demand continues to strengthen, with early June delivering approximately 10% year-over-year growth. Early indicators suggest a robust second half of 2026 for intermodal.
Through the first five months of 2026, total intermodal volume rose modestly on an annual basis, with domestic containers performing particularly well, reaching a level representing a meaningful annual increase. Monthly volume index readings have remained among the highest of the year, offering a real-time picture of intermodal freight economics ahead of official monthly figures.
Modal Shift Drivers: The current environment is expanding the number of lanes where intermodal transportation represents a compelling alternative. Truckload carriers continue to face structural cost pressures, including maintenance, insurance, and driver wages, expected to remain elevated even as fuel prices stabilize.
Demand growth is most pronounced in the 550–1,500 mile range, where freight that previously shifted back to truckload during softer market conditions is returning to intermodal. Stricter regulations on truck drivers, combined with elevated costs, are accelerating the shift toward intermodal nationwide.
Capacity Constraints in Key Markets
Regional Tightening: Markets experiencing notable increases in intermodal demand include Atlanta, Chicago, Dallas, Houston, Jacksonville, Los Angeles, and Toledo, Ohio. As of mid-June, several markets were identified as capacity-constrained, prompting rail carriers to prioritize container reservations for committed customers.
West Coast Challenges: Shippers seeking committed contract rates out of Southern California should expect limited availability, with new long-term agreements unlikely to begin until late in the year given current market constraints. In the near term, shippers moving freight out of California face higher rates and limited capacity. Other regions are seeing more moderate increases for committed intermodal pricing.
Fuel Cost Dynamics and Structural Advantages
Diesel Price Impact: The U.S. average diesel price has been elevated well above year-ago levels for much of 2026. While diesel dipped somewhat in late June, prices remain elevated.
Fuel Surcharge Structure: A key structural distinction remains critical for shippers evaluating modal options. Intermodal fuel surcharges are typically percentage-based and tied to linehaul rates, while truckload fuel surcharges are generally calculated on a per-mile basis. Applying truckload fuel structures to intermodal movements can unnecessarily inflate costs. Shippers that align fuel programs with intermodal methodologies are better positioned to preserve savings in a high-fuel-cost environment.
4 · Ports and Ocean Freight: Record Volumes and Early Peak Season
U.S. ports are experiencing a historic surge in import volumes, driven by tariff front-loading ahead of anticipated policy changes.
Record Import Volumes
July 2026 Projections: U.S. ports are forecast to handle a record monthly volume in July 2026, surpassing the previous monthly high set in May 2022. This represents a meaningful increase from July 2025.
The surge reflects continued front-loading by importers seeking to avoid higher costs tied to expected changes in U.S. trade policy. This year’s early peak season is expected to continue through July as retailers and other importers prepare for potentially higher tariffs beginning in August and other trade uncertainties.
First-Half Performance: May 2026 volumes reached a level up substantially year-over-year and meaningfully higher than April. June is projected to show similarly strong year-over-year growth. Total imports for the first half of 2026 are expected to run modestly higher than the same period last year.
Post-July Retreat: Volumes are generally expected to retreat after July as the front-loading effect works through the system, with August forecast lower year over year, followed by further declines through the fall months.
Tariff Policy Drivers
Multiple Policy Uncertainties: Several tariff-related factors are driving the front-loading behavior, including the scheduled expiration of temporary global tariffs imposed earlier in the year and the anticipated introduction of a new round of tariffs targeting goods linked to forced labor practices.
Industry analysts note that the recent increase in cargo volumes is largely being driven by anticipated policy changes, with much of the increase reflecting front-loading ahead of expected tariff increases.
Port Operations and Congestion
Remarkable Efficiency: Despite the record volumes, there are few signs of congestion at the nation’s largest gateway complex. Vessel anchorage counts have remained low, indicating that terminals continue to handle elevated cargo flows without significant vessel queues.
Ocean Capacity Dynamics: Ocean freight capacity is tightening unevenly as pull-forward demand, service withdrawals, equipment constraints, and routing disruption create different booking risks by trade lane. Shippers should evaluate why each lane is tight, not only whether space is available. Far East to U.S. West Coast rates have remained relatively stable week over week even amid the broader volume surge.
5 · Cross-Border Trade: USMCA Uncertainty and Diverging Conditions
The cross-border freight environment is showing significant divergence between Mexico and Canada, compounded by unprecedented uncertainty surrounding the future of the USMCA trade agreement.
USMCA Non-Renewal: A Watershed Moment
The July 1 Decision: On July 1, 2026, the United States declined to renew the United States-Mexico-Canada Agreement for another 16-year term. Mexico and Canada had each confirmed that they wished to extend the agreement, but the U.S. declined.
Immediate Implications: The USMCA has not been immediately terminated, but Washington’s decision initiated an annual review process, forcing critical sections of the trade framework into a state of ongoing renegotiation. This breaks the long-term stability that had been a hallmark of North American trade relations.
The U.S. has already revised certain trade terms under the USMCA framework by imposing tariffs on automobile imports from Mexico and Canada, steel and aluminum, and lumber.
Future Scenarios: Baseline expectations suggest a renewal of the USMCA, if it occurs, would not come earlier than the second half of the current forecast period. If no extension agreement can be reached, the agreement would eventually expire in 2036.
Mexico: Tight Capacity and Growing Demand
Cross-Border Pressure: Mexico routes face tight capacity, border delays, and firm pricing as exports grow. The growth in Mexican manufacturing and export volumes, driven in part by nearshoring trends, is creating sustained pressure on cross-border transportation capacity.
Canada: Softer Conditions
Muted Demand: Canada remains softer amid muted demand and USMCA uncertainty. The Canadian freight market remains balanced despite ongoing cost pressures. The divergence between Mexico and Canada reflects different trade dynamics, with Mexico benefiting from nearshoring investment while Canada faces more challenging economic conditions and trade policy uncertainty.
6 · Fuel Costs and Economic Indicators
Fuel prices and broader economic indicators provide important context for understanding logistics market dynamics.
Diesel Price Environment
Elevated Levels: The U.S. average diesel price has remained elevated relative to year-ago levels, representing a substantial cost pressure across all transportation modes. While some easing has occurred at times, the sustainability of any relief remains uncertain, adding complexity to transportation planning.
Inflation and Economic Indicators
Continued Cost Pressure: Elevated consumer and producer price indices indicate continued upward pressure on transportation and supply chain costs. These macroeconomic pressures are likely to sustain rate increases across transportation modes.
Demand Drivers: Manufacturing expansion and data center construction support freight demand, while housing and consumer sentiment remain comparatively weak. The broader technology infrastructure buildout remains particularly strong, supporting sustained freight activity in certain corridors and sectors.
7 · Strategic Considerations for Shippers
Organizations navigating the current North American logistics environment may find value in considering several strategic approaches.
Capacity and Rate Management
Planning Horizons: With capacity tightening across truckload and intermodal markets, extending planning horizons has become increasingly valuable. Shippers can consider securing committed capacity where possible, particularly for high-volume lanes, and evaluating longer-term agreements to help manage rate exposure.
Modal Optimization: The widening gap between truckload and intermodal costs makes modal optimization worth revisiting. Evaluating lanes in the 550–1,500 mile range for intermodal conversion, aligning fuel programs with modal-specific methodologies, and assessing total landed cost rather than linehaul rates alone can all support better decision-making.
Route Guide Management: With route guide performance deteriorating, reviewing and potentially expanding carrier networks, developing more robust backup strategies for critical lanes, and considering how long-haul versus short-haul routing affects carrier acceptance are worthwhile exercises.
Tariff and Trade Policy Navigation
Front-Loading Considerations: The current front-loading environment presents both opportunities and risks. Assessing exposure to potential tariff changes, weighing inventory positioning strategies against carrying costs, and monitoring statutory tariff expiration dates all support more informed planning.
Cross-Border Strategy: The USMCA non-renewal creates new considerations for cross-border operations. Evaluating supply chain exposure to potential tariff changes, considering diversification of cross-border routing options, and monitoring the USMCA annual review process closely can help organizations stay ahead of developments.
Technology and Visibility
Enhanced Visibility: In a tightening market with increasing volatility, visibility becomes increasingly valuable. Investing in real-time shipment tracking, developing predictive capabilities for rate and capacity forecasting, and leveraging data analytics all support more informed decision-making.
Financial Planning
Budget Considerations: With spot and contract rates both trending higher, adjusting transportation budgets to reflect expected costs, building contingency for continued rate volatility, and accounting for fuel surcharge structures across modes can help organizations avoid unwelcome surprises.
8 · Outlook: What to Expect in the Second Half of 2026
Near-Term Projections
Continued Tightening: Carrier discipline and shifting volumes could continue to shape capacity and pricing into the second half of 2026. The structural factors driving capacity constraints—regulatory pressures, limited fleet expansion, and elevated operating costs—show no signs of abating in the near term.
Rate Trajectory: With spot rates significantly outpacing contract rates, continued upward pressure on contract pricing appears likely. The next contract cycle is expected to see substantial increases across much of the market.
Port Volume Normalization: After the July record, import volumes are expected to retreat, though the magnitude of the decline remains uncertain and will depend heavily on the trajectory of trade policy.
Long-Term Structural Changes
Intermodal Adoption: The current environment is likely to accelerate longer-term intermodal adoption as shippers recognize the cost advantages and reliability benefits relative to an increasingly constrained truckload market.
Manufacturing Geography: USMCA uncertainty and the broader tariff environment may accelerate manufacturing relocation decisions, with Mexico potentially continuing to benefit from nearshoring trends despite trade policy uncertainty.
Regulatory Evolution: Ongoing regulatory pressures on the trucking industry—including English proficiency requirements, immigration policies affecting CDL holders, and enforcement against less reputable operators—are likely to sustain capacity constraints for the foreseeable future.
9 · Conclusion: Navigating a Transforming Market
Market Realities
The North American logistics market in July 2026 is undergoing a significant transformation. Capacity has tightened across truckload networks, spot rates have surged to levels not seen since 2022, and the structural factors driving these changes show few signs of abating. Record import volumes at U.S. ports, accelerating intermodal adoption, and unprecedented USMCA uncertainty are reshaping the logistics landscape.
Strategic Themes
Proactive Planning: Extended planning horizons and earlier capacity commitments have become increasingly valuable in an environment where waiting until the last minute limits options and increases costs.
Modal Optimization: The widening gap between truckload and intermodal costs makes modal optimization a worthwhile ongoing exercise, with lane-by-lane evaluation and fuel program alignment supporting meaningful savings.
Tariff Vigilance: The current front-loading environment and evolving tariff policy call for continuous monitoring and flexible response capabilities, with organizations benefiting from understanding their exposure to potential policy changes.
Cross-Border Awareness: The USMCA non-renewal creates new uncertainties for cross-border operations. Understanding supply chain exposure and monitoring developments closely can help organizations respond effectively as the annual review process unfolds.
Looking Ahead
The second half of 2026 promises continued challenges and opportunities. Organizations that approach the market with a clear understanding of the underlying dynamics, appropriate planning, and effective execution of tactical requirements will be well positioned to navigate this environment and position themselves for the years ahead.
This analysis reflects North American logistics market conditions as of July 2026 based on available data and industry reporting. Market conditions evolve continuously and specific circumstances vary by company, product, and trade lane. Organizations managing North American logistics may wish to consult with logistics providers, transportation specialists, and supply chain professionals for guidance tailored to their specific requirements and circumstances.