
Executive Summary
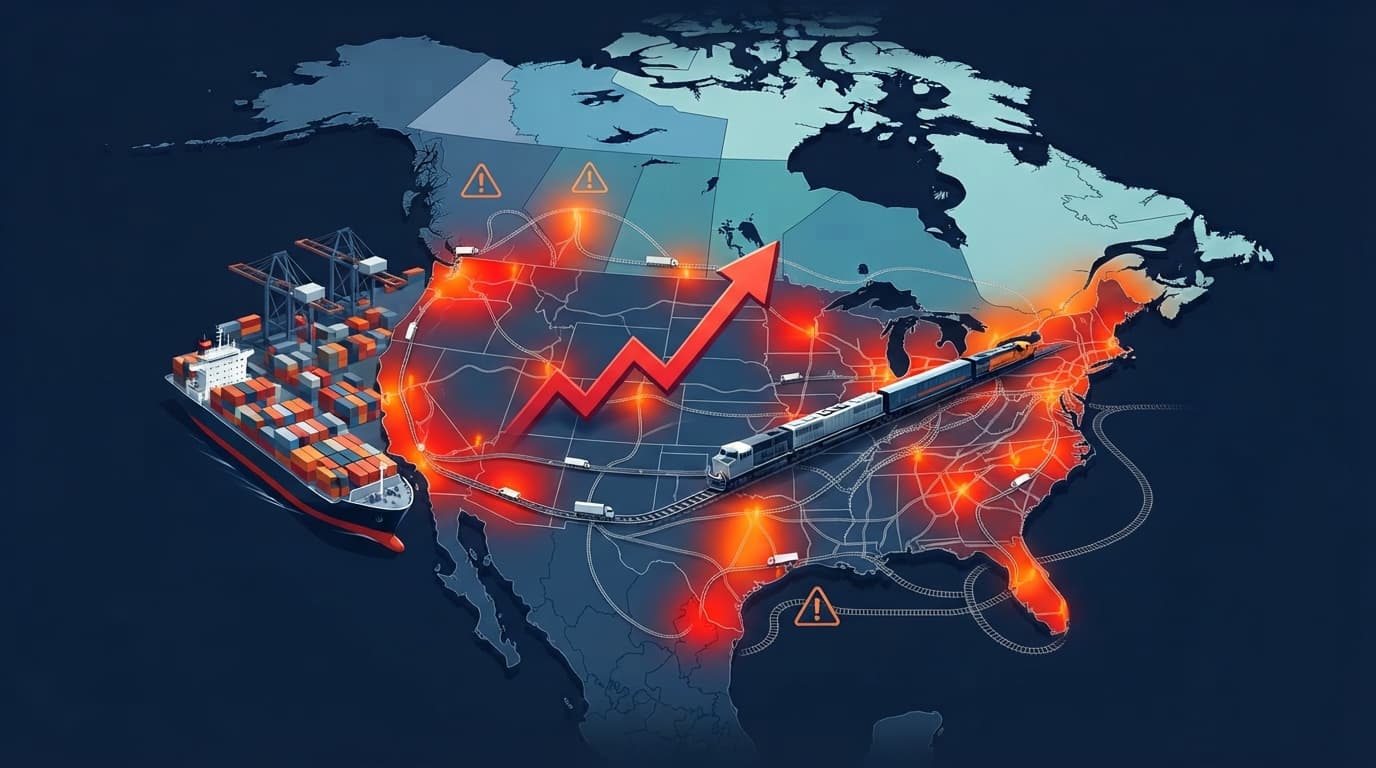
After nearly four years of margin compression and soft freight demand, the U.S. truckload market has turned. The recovery, however, differs from prior cycles in a fundamental way: it is being driven not by a surge in consumer spending or inventory restocking, but by the systematic removal of capacity from the market. A wave of carrier bankruptcies in 2025, combined with intensified federal enforcement targeting non-domiciled commercial driver’s licenses and other regulatory gaps, has accelerated a supply-side correction that consumer demand alone has not driven. Spot linehaul rates rose sharply across all equipment types through the first half of 2026, with average van spot rates exceeding contract rates for the first time since early 2022. This analysis examines the supply-driven nature of the recovery, the forces behind capacity exit, and the strategic implications for shippers navigating a meaningfully transformed truckload market.
Vanishing Capacity Ends the Freight Recession: Understanding a Supply-Driven Recovery
(运力消失终结货运衰退:供给驱动型市场复苏解读)
1 · A Recovery Unlike Previous Cycles
The Turn Becomes Undeniable
By mid-2026, industry observers had largely stopped debating whether the multi-year truckload downturn had ended and turned instead to characterizing how it ended. After roughly thirteen consecutive quarters of margin compression, carrier exits, and rate floors that repeatedly failed to hold, market conditions entering 2026 looked meaningfully different: capacity had contracted to levels not seen since before the post-pandemic freight boom, and spot rates were tracking materially higher on a year-over-year basis.
The distinguishing feature of this cycle is straightforward but significant. Every prior freight market tightening in recent memory has been demand-led—driven by consumer spending surges, inventory restocking cycles, or manufacturing rebounds. This time, the tightening has been supply-led: capacity has been removed from the market, largely independent of any broad-based increase in shipping demand.
The Data Confirms a Supply-Side Story
The evidence supporting this distinction is found in the relationship between rates and volumes rather than in either figure alone. Spot rates climbed faster than freight volumes through the first half of 2026, a divergence that points toward tighter truck capacity rather than stronger underlying freight demand. Industry volume indices rose across equipment types compared to the prior month, but volumes remained flat to lower on a year-over-year basis even as rates climbed sharply—a pattern consistent with capacity contraction rather than demand expansion as the primary driver of the recovery.
2 · The Capacity Exit: How Trucks Left the Market
Bankruptcy and Carrier Attrition
The scale of carrier attrition over the past two years has been substantial. More than 200 fleets operating 250 trucks or more filed for bankruptcy in early 2025, contributing to a roughly 35 percent year-over-year increase in carrier failures. Throughout 2025 and into 2026, carriers continued to exit the market at an elevated pace, with thousands of smaller operators ceasing operations.
Given the trucking industry’s highly fragmented structure—more than 580,000 active motor carriers remain registered with the Federal Motor Carrier Safety Administration (FMCSA)—even relatively small individual carrier exits aggregate into meaningful capacity reduction across the industry when compounded at scale. Years of unprofitable rates, exhausted balance sheets, and the depletion of pandemic-era financial buffers left many smaller carriers with little room to continue absorbing losses.
The Enforcement Dimension
Not all of the recent capacity exit reflects ordinary market discipline. A meaningful share appears attributable to regulatory enforcement rather than organic attrition, as regulators on both sides of the U.S.-Canada border have intensified oversight of long-standing compliance gaps within the industry.
The Non-Domiciled CDL Rule: The most consequential enforcement action has been the FMCSA’s final rule narrowing eligibility for non-domiciled commercial driver’s licenses (CDLs) and commercial learner’s permits, effective March 2026. The rule restricts non-domiciled CDL eligibility to individuals holding specific employment-based nonimmigrant visa classifications—namely H-2A, H-2B, or E-2 visas—effectively excluding DACA recipients, refugees, asylum seekers, and Temporary Protected Status holders from obtaining or renewing these licenses.
The practical effect has been significant: the existing population of roughly 200,000 non-domiciled CDL holders is expected to shrink sharply, with only a small fraction of new non-domiciled CDLs—on the order of a few thousand—expected to be issued under the narrowed criteria. Because non-domiciled CDL holders have historically represented a meaningful share of the lower-cost capacity segment, this regulatory tightening has disproportionately affected smaller and mid-size carriers.
Broader Enforcement Actions: Beyond the CDL rule, federal enforcement has expanded to target non-compliant electronic logging devices, so-called CDL mills, “chameleon carriers” that reconstitute under new names to evade safety records, and drivers unable to meet English language proficiency requirements. This broader enforcement push has addressed compliance gaps that, for years, went largely unaddressed relative to the scale of the industry.
A Corrective Effect on Industry Structure
The cumulative effect of these enforcement actions has been to narrow the gap between compliant, well-capitalized carriers and a segment of the industry that had been operating with minimal insurance coverage, informal employment arrangements, deferred equipment maintenance, and limited tax compliance. This imbalance had, over time, suppressed rates and wages across the broader carrier base by allowing lower-cost, non-compliant operators to undercut carriers bearing the full cost of regulatory compliance. The recent wave of enforcement-driven capacity exit represents, in effect, a structural correction to that imbalance.
3 · The Rate Response: What the Numbers Show
Spot Rates Lead the Recovery
Capacity contraction has translated directly into rate increases across all major equipment types. The national average van truckload spot rate exceeded the contract rate in June 2026 for the first time since February 2022—a widely watched signal that a market has shifted meaningfully in carriers’ favor.
June 2026 Spot Rates (approximate, per mile):
- Van: $3.00, up roughly 11 cents from May
- Refrigerated: $3.39, up roughly 4 cents from May
- Flatbed: $3.69, up roughly 4 cents from May to a record high
Linehaul Rate Increases, Excluding Fuel (approximate, per mile):
- Van: $2.37, up roughly 21 cents from May
- Refrigerated: $2.70, up roughly 14 cents from May
- Flatbed: $2.94, up roughly 16 cents from May to a record high
Year-Over-Year Growth: National average van linehaul rates rose by roughly 74 cents year-over-year in June, with refrigerated rates up roughly 76 cents and flatbed rates up roughly 84 cents. On a percentage basis, this represents increases of approximately 45 percent for van freight, 39 percent for refrigerated freight, and 40 percent for flatbed freight—among the largest year-over-year linehaul rate increases recorded in several years for each respective equipment type.
The Spot-Contract Gap Narrows
The historical gap between spot and contract rates has compressed considerably. Spot linehaul pricing increased by more than 23 percent over a roughly twelve-month period, while contract rates rose by a comparatively modest 5 percent over the same window. By early 2026, the gap between average spot and contract rates had narrowed to roughly 11 cents per mile, representing a compression of approximately 28 cents per mile from where the gap had previously stood.
Forward Rate Expectations: Industry forecasters have revised 2026 rate projections upward as the year has progressed. Some analysts now project full-year 2026 dry van spot rates roughly 34 percent higher year-over-year, with year-end spot rates across all three major equipment types projected to finish approximately 30 percent higher than the prior year. Contract rates are similarly expected to continue climbing as the gap with spot pricing closes further, with some forecasts pointing toward record contract rate levels by the end of 2026.
Tender Rejections Signal Carrier Leverage
Tender rejection rates—the percentage of freight tenders that carriers decline—have climbed to their highest levels since 2022, reflecting carriers’ improved ability to be selective about the freight they accept. Van tender rejection rates reached roughly 18 percent and refrigerated rejection rates approached 25 percent in June 2026, signaling capacity strain well beyond typical seasonal tightening.
4 · Capacity Indicators: Measuring the Shrinking Supply
Capacity Index Trends
Industry capacity indices have climbed to multi-year highs, with one closely watched index reaching a 43-month high in June 2026. This increase, however, appears to reflect expansion among larger, well-capitalized fleets rather than a broad-based recovery in overall industry capacity, since new Class 8 truck sales have remained below replacement levels across the industry as a whole.
Further capacity tightening is generally expected in the second half of 2026, as spot rate gains gradually flow through into contract rates and as carriers begin replacing aging equipment ahead of anticipated EPA 2027 emissions requirements.
Driver Availability Remains Constrained
Driver availability metrics, while showing modest month-over-month improvement, remain significantly depressed relative to historical norms. A wave of regulatory changes—including the non-domiciled CDL restrictions, tighter enforcement around electronic logging device compliance and registration fraud, and the closure of numerous driver training schools—pushed driver availability to a multi-year low earlier in 2026, shortly after the non-domiciled CDL rule took effect. Continued driver scarcity is generally expected to support elevated freight rates going forward.
Fleet Investment Remains Cautious
Fleet purchase intentions have remained below historical averages, with roughly less than half of surveyed carriers planning equipment purchases in the near term—below the typical seasonal benchmark. Two factors appear to be restraining capital investment: carrier profit margins entering 2026 stood at levels not seen since the 2008-2009 recession, limiting available capital, and the multi-month lag between spot rate gains and contract rate improvements has left many larger carriers with limited near-term margin improvement despite the broader rate recovery.
5 · The Demand Picture: Narrow and Uneven
Not a Broad Consumer-Led Recovery
The supply-driven recovery has unfolded against a backdrop of demand that remains uneven across sectors. Strength has been concentrated in industrial freight—particularly freight tied to data center construction—which has helped push flatbed spot rates to record highs, while consumer-oriented freight volumes have remained comparatively soft.
Although spot rates are at multi-year highs and tender rejection rates have reached their highest levels since 2022, the underlying demand supporting these figures appears narrow, concentrated in industrial categories rather than reflecting a broad-based consumer freight rebound. The broader macroeconomic backdrop has been characterized as fragile but stabilizing, with most GDP growth forecasts for 2026 in a modest range sufficient to stabilize freight demand but insufficient to quickly absorb the excess capacity built up during the earlier pandemic-era freight boom.
A Capacity-Led Rebalancing
Taken together, the data point toward a market rebalancing driven primarily by capacity exit rather than demand growth. Freight tonnage measures have generally moved lower even as rates have moved higher—a combination that would be difficult to explain through demand growth alone, and that instead points clearly toward capacity contraction as the primary driver of the current market recovery.
6 · Strategic Considerations for Shippers
A Meaningfully Different Market
The supply-driven nature of this recovery represents a genuine shift in market dynamics that shippers should factor into their planning. Reduced over-the-road capacity has fueled gains in both spot and contract rates, giving carriers a degree of pricing leverage they have not held in several years. After an extended and difficult period for carriers, the truckload supply-demand imbalance finally appears to be correcting—though the correction itself creates new planning considerations for the shipper community.
With capacity tighter and compliance costs rising industry-wide, larger and better-capitalized carriers appear increasingly favored in the current environment, while barriers to entry for smaller carriers have risen alongside stricter enforcement.
Planning Considerations
Earlier Contracting: Shippers may find value in securing contract capacity earlier in the bid cycle than they have in recent years, given the reduced likelihood that abundant spot capacity will remain available at favorable rates when needed. The dynamics of recent years, when spot market capacity was broadly available at competitive pricing, appear to be giving way to a market where advance planning carries greater value.
Weighing Capacity Assurance Alongside Price: In a tighter capacity environment, carriers are increasingly able to prioritize relationships with shippers who have demonstrated reliability and partnership through the prior downturn. Shippers relying primarily on spot market coverage as a core strategy are, in effect, betting that additional capacity will reliably be available at the moment it is needed—an assumption that carries more risk in the current environment than it did during the preceding soft market.
Considering Modal Diversification: As truckload capacity tightens, some shippers may find it useful to shift a portion of freight into LTL networks or intermodal service where appropriate, alongside broader network optimization and shipment consolidation efforts, to help manage capacity risk across their transportation portfolio.
Weighing Reliability Alongside Cost: With carriers continuing to exit the market amid tightening credit conditions and thin historical margins, shippers who have relied heavily on the lowest available spot-market rates may increasingly encounter capacity shortfalls, detention costs, and service disruptions. In the current environment, the lowest-cost option is not necessarily the lowest-risk option, and total cost of service is worth weighing alongside headline rates.
7 · Outlook: A Structural Shift Rather Than a Cyclical Blip
Signs of Durability
The capacity contraction underpinning the current recovery appears more structural than temporary. The regulatory changes driving a meaningful share of recent capacity exit—including the non-domiciled CDL rule and intensified FMCSA enforcement more broadly—are not temporary measures subject to reversal in the near term, suggesting that at least part of the capacity reduction observed to date is likely to persist.
The Next Contract Cycle
Forecasters generally expect total truckload contract rates to continue climbing through the remainder of 2026 and into 2027 before eventually leveling off, suggesting that the upcoming contract cycle may prove more challenging for shippers than several of the preceding years.
Broader Supply Chain Implications
The supply-driven recovery in truckload is unfolding alongside broader shifts across the logistics landscape. Motor carrier expenditures have grown meaningfully as carrier exits have tightened capacity and supported a supply-driven rate recovery, even amid mixed underlying freight demand. These structural changes within the truckload segment are likely to have knock-on effects across other transportation modes as shippers adjust sourcing, routing, and modal strategies in response.
8 · Conclusion: A Recovery Defined by Its Cause
A Market Transformed
The 2026 truckload market recovery is notable less for the fact that it occurred—market cycles eventually turn—than for how it occurred. Rather than being driven by a surge in consumer spending, a manufacturing boom, or broad inventory restocking, this recovery has been driven primarily by the systematic removal of capacity from the market.
What the Data Shows
More than 200 fleets operating 250 trucks or more filed for bankruptcy in early 2025. Federal enforcement actions have removed a substantial number of drivers from the labor pool through the non-domiciled CDL rule and related compliance efforts. Spot linehaul rates rose by roughly 39 percent or more year-over-year across major equipment types by mid-2026. Capacity indices reached multi-year highs even as underlying demand remained uneven, and average van spot rates exceeded contract rates for the first time in several years.
A New Planning Environment for Shippers
This supply-driven recovery represents a genuine shift in market dynamics rather than a temporary pricing anomaly. Shippers who treat the current environment as a short-lived pricing blip may find themselves caught off guard by continued rate pressure and capacity constraints. Those who recognize the structural nature of the changes affecting carriers, lanes, and contract dynamics will generally be better positioned to manage transportation costs without sacrificing service reliability.
The recovery itself is, at this point, no longer meaningfully in question. What distinguishes this cycle—and what shippers should keep firmly in mind—is that it has been driven by disappearing supply rather than surging demand, a distinction with real implications for how transportation strategy should be structured in the period ahead.
This analysis reflects U.S. truckload market conditions as of July 2026 based on available industry data and reporting. Market conditions evolve continuously and specific circumstances vary by shipper, lane, and commodity. Organizations managing transportation should consult with logistics providers and supply chain professionals for guidance tailored to their specific requirements and circumstances.