
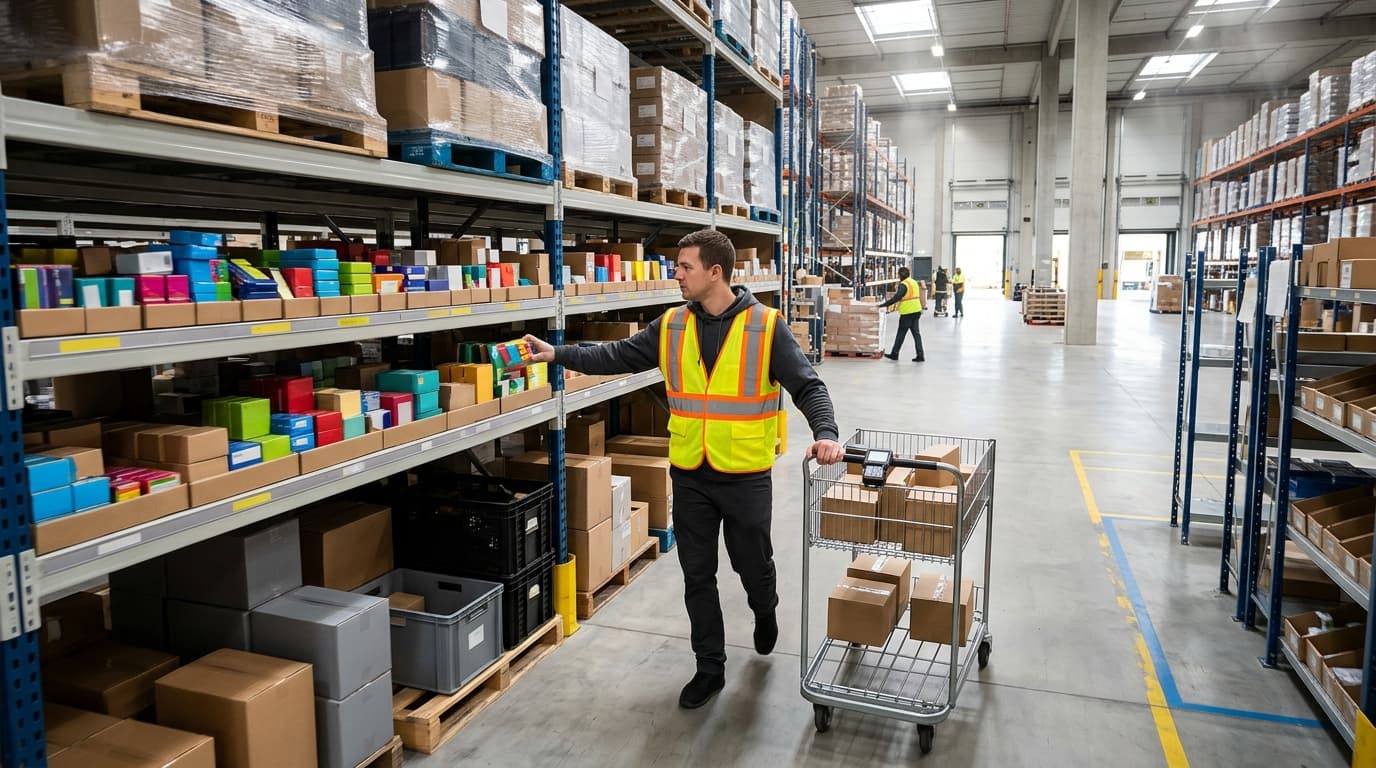
Executive Summary Slotting is the decision of which product goes in which location. It sounds like housekeeping, but in a picking operation it determines how far people walk, how often they bend and reach, how often pick faces are refilled, and how often the wrong item is picked. Warehouse research has long identified travel as the largest single component of manual order-picking time, and travel is driven primarily by where products sit. Good slotting starts with data, chiefly pick frequency (lines, not units), cube movement, and item dimensions, and ranks SKUs with measures such as the cube-per-order index (COI). It then applies placement rules: the most-picked items closest to the start of the pick path and in the golden zone between waist and shoulder height, heavy items low and early in the path, items often ordered together near one another, and look-alike items apart. Pick-face size is balanced against replenishment labor, and the layout is re-slotted when demand shifts enough to justify the cost of moving product. In an illustrative example below, concentrating the 20% of SKUs that account for 80% of picks at the front of an aisle cuts average travel per pick by about 60% compared with random placement. This guide explains each step and the KPIs that show whether slotting is working. It builds on our Warehouse Layout Optimization Manual, which covers the building-level design within which slotting takes place.
Warehouse Slotting Guide: How Product Placement Reduces Pick Time, Travel Distance, and Labor Cost
(仓库货位规划指南:商品摆放如何缩短拣货时间、行走距离并降低人工成本)
1 · What Slotting Is, and Why It Matters
Slotting vs. Layout
| Decision | Layout | Slotting |
|---|---|---|
| Question | What zones, racks, aisles, and flows does the building have? | Which SKU goes in which location within that structure? |
| Time horizon | Years | Weeks to months |
| Cost to change | High (construction, racking, equipment) | Lower (labor to move product, system updates) |
| Main drivers | Volume, product mix, equipment, building shape | Demand by SKU, item dimensions, order patterns |
Layout sets the stage; slotting decides who stands where on it. A well-designed building with poor slotting still produces long walks and frequent replenishment.
Where Picking Time Goes
In manual “person-to-goods” picking, a picker’s time is commonly divided into travel between locations, searching for the item at the location, extracting (reaching, bending, picking), and setup and documentation. Facilities planning research has long found that travel is the largest component, often cited as around half of picking time. Because travel depends on how far apart the needed items are, slotting is the most direct lever on it.
What Slotting Affects
| Area | How Slotting Affects It |
|---|---|
| Travel distance | Frequently picked items close to the start of the path shorten walks |
| Extraction time and ergonomics | Items at waist-to-shoulder height are faster and less strenuous to pick |
| Replenishment labor | Pick-face size determines how often the face must be refilled |
| Accuracy | Separating look-alike items reduces mis-picks |
| Congestion | Spreading very fast movers prevents bottlenecks in a single aisle |
| Product protection | Heavy items below light ones and crushable items on top reduce damage |
⚠️ Critical Takeaway: Slotting is the cheapest change that affects the largest share of picking time. It changes no equipment, only where things are.
2 · The Data Slotting Requires
Item Data
| Field | Why It Matters |
|---|---|
| Dimensions (each, inner, case) | Determine which location types the item fits and how many fit |
| Weight | Drives height placement, sequencing, and lifting limits |
| Unit of measure picked | Each, inner pack, case, or pallet picking use different location types |
| Handling attributes | Fragile, crushable, hazardous, temperature-sensitive, high-value |
| Product family and look-alikes | Used for grouping and for separating similar items |
Demand Data
| Field | Why It Matters |
|---|---|
| Pick lines (hits) per period | The main driver of travel: each line is a visit to a location |
| Units per period | Drives how fast the pick face empties and replenishment frequency |
| Cube movement | Units × unit cube; how much space the item’s demand consumes |
| Order co-occurrence | Which items tend to appear on the same orders |
| Seasonality and trend | Whether current demand is a good predictor of next month’s |
A Common Pitfall: Units vs. Lines
Ranking SKUs by units shipped rather than pick lines is one of the most common slotting errors. An item shipped 1,000 units at a time on a few orders generates few visits; an item shipped one unit at a time on hundreds of orders generates many. For travel, visits matter.
⚠️ Critical Takeaway: Clean item dimensions and pick-line history are prerequisites. Slotting on inaccurate dimensions produces locations that items do not fit.
3 · Ranking SKUs
Pick-Frequency (ABC) Ranking
The simplest approach ranks SKUs by pick lines and groups them, often into A, B, and C classes, with A items placed in the most accessible locations. In many operations, demand is concentrated: a small share of SKUs accounts for a large share of picks. Our layout manual explains ABC analysis in more detail.
Cube-Per-Order Index (COI)
Pick frequency alone ignores how much space each item needs. A very bulky item that is picked often may consume so much prime space that it pushes many other frequently picked items further away. The cube-per-order index, a long-established measure in warehousing research, addresses this:
COI = storage cube required for the item ÷ number of picks (order lines) for the item
Items with the lowest COI, meaning many picks for little space, go in the most accessible locations.
| SKU | Storage Cube Needed (cu ft) | Picks per Day | COI | Priority for Prime Locations |
|---|---|---|---|---|
| A | 2 | 200 | 0.01 | 1 |
| B | 20 | 200 | 0.10 | 2 |
| C | 2 | 10 | 0.20 | 3 |
| D | 40 | 50 | 0.80 | 4 |
Illustrative figures. SKUs A and B have the same pick frequency, but A needs a tenth of the space and therefore ranks higher. SKU C is small but rarely picked.
Affinity
Items that frequently appear on the same order, such as a printer and its cables, or a product and its common accessory, can be placed near each other so that one trip serves both. Affinity analysis looks at order co-occurrence rather than individual volume, and is particularly useful in operations with multi-line orders.
4 · Placement Rules
Distance: Fastest Movers Closest
Frequently picked, low-COI items are placed closest to the start and end of the pick path, typically the area nearest the pick-and-drop or packing stations, so that the most common trips are the shortest.
Height: The Golden Zone
Locations between roughly waist and shoulder height are the fastest and least strenuous to pick from, and are often called the golden zone. The Revised NIOSH Lifting Equation, NIOSH’s ergonomic tool for evaluating two-handed lifting, reflects this: its recommended weight limit starts from a load constant of 51 lb (23 kg) under ideal conditions and is reduced as the hands move away from the body, start lower or higher than about 30 inches (75 cm) from the floor, or travel farther vertically, among other factors.
| Height Band | Typical Use |
|---|---|
| Waist to shoulder (golden zone) | Highest-frequency items |
| Knee to waist | Medium-frequency items; heavier items |
| Above shoulder | Low-frequency, light items |
| Floor level | Heavy or bulky items handled by equipment; low-frequency items |
Weight and Sequence
Heavy items are commonly placed low and early in the pick sequence, so they sit at the bottom of the tote or cart and do not crush lighter items picked later.
Separation of Look-Alikes
Items that look similar, such as the same product in different sizes or colors, are often placed apart, at different heights, or in different aisles, to reduce mis-picks.
Spreading the Fastest Movers
Putting every top item in one aisle can create congestion when several pickers converge. Distributing the fastest movers across the first locations of several aisles keeps travel short without creating a bottleneck.
Handling and Regulatory Constraints
Hazardous materials, temperature-controlled goods, high-value items, and goods that must be kept separate for regulatory or customer reasons have locations that override velocity-based rules.
⚠️ Critical Takeaway: Velocity decides the shortlist for prime locations; weight, ergonomics, congestion, and product constraints decide the final placement.
5 · Worked Example: How Much Travel Slotting Saves
Consider a single aisle with 100 pick locations spaced 1 meter apart, a picker who starts and ends at the front of the aisle, and single-line orders. Assume demand follows a common concentration pattern: 20% of SKUs account for 80% of picks.
| Slotting Approach | Average Round-Trip Travel per Pick |
|---|---|
| Random placement (any SKU in any location) | About 101 m |
| Velocity-based placement (top 20 SKUs in the first 20 locations) | About 41 m |
| Reduction | About 59% |
Illustrative calculation. With random placement, the average location is about 50.5 m from the front, or 101 m round trip. With velocity-based placement, 80% of picks go to locations averaging 10.5 m away and 20% to locations averaging 60.5 m away. Real results depend on demand concentration, layout, order profile, and picking method.
The example is deliberately simple, but the principle holds more generally: when demand is concentrated, placing the busiest items near the start of the path removes a large share of walking.
6 · Sizing Pick Faces: The Replenishment Trade-Off
Why Size Matters
Every pick location has to be refilled from reserve storage. A pick face that holds less than a day’s demand needs replenishing more than once a day; a pick face that holds a month’s demand uses space that could have held other fast movers.
| Item Demand | Pick-Face Capacity | Replenishments per Day |
|---|---|---|
| 120 units/day | 120 units | 1.0 |
| 120 units/day | 240 units | 0.5 |
| 120 units/day | 60 units | 2.0 |
Illustrative. Halving the pick-face size doubles replenishment trips; doubling it halves them but consumes more prime space.
Days of Supply as a Rule of Thumb
Many operations size pick faces in days of supply, for example enough for a set number of days at expected demand, with adjustments for case-pack size and replenishment timing. Replenishment that must happen during picking hours can also cause congestion and stock-outs at the pick face, so some operations plan to replenish fast movers before or between picking waves.
Allocating Limited Forward Space
When a forward pick area has limited space, the question is how much of it to give each item. Warehouse science research, notably the work of Bartholdi and Hackman, has shown that under common assumptions, allocating forward space in proportion to the square root of each item’s flow minimizes total replenishment, rather than allocating equal space or equal days of supply to every item.
⚠️ Critical Takeaway: Pick-face size is a trade-off between picking travel and replenishment labor. Measuring both shows where the balance lies.
7 · Slotting and Picking Methods
The best slotting depends on how orders are picked.
| Picking Method | Slotting Emphasis |
|---|---|
| Discrete (one order at a time) | Fast movers near the start and end of the path; affinity grouping for multi-line orders |
| Batch (several orders at once) | Fast movers clustered so that a batch covers fewer locations |
| Zone | Balancing workload across zones so no zone becomes a bottleneck |
| Wave | Grouping items needed by the same carrier cutoff or shipping wave |
| Goods-to-person (automated) | Slotting shifts from aisles to storage positions and inventory distribution across the system |
E-Commerce Operations
E-commerce fulfillment typically combines very large SKU counts, small, single-line orders, strong seasonal peaks, and a steady flow of returns. In this environment, demand concentration and order affinity tend to shift quickly, so re-slotting cadence and returns put-away strategy matter more than in operations with stable, case-level demand. Our analysis of returns as a peak problem discusses the returns side.
8 · Re-Slotting: When and How
Triggers
| Trigger | Example |
|---|---|
| Demand shift | An item’s pick frequency moves it into a different class |
| Seasonality | Seasonal items brought forward before peak and moved back after |
| New items | Launches with no history placed on forecast, then reviewed |
| Discontinued items | Prime locations held by items with falling demand |
| Operational signals | Rising travel per line, congestion in particular aisles, frequent stock-outs at pick faces |
Weighing the Cost of Moves
Every move consumes labor and creates a short window when the item is in transit between locations. Re-slotting is generally worthwhile where the expected savings in travel or replenishment over the coming period exceed the labor of the moves. Many operations therefore re-slot the highest-impact items frequently and the rest less often, rather than reorganizing the whole warehouse at once.
Execution
Moves are commonly scheduled in off-peak hours, executed in the warehouse management system (WMS) and on the floor at the same time so that system locations match physical locations, and followed by a check of the new locations.
The Role of the WMS
Many WMS platforms include slotting modules or integrate with dedicated slotting software. These tools apply the same principles at scale, ranking items, suggesting moves, and estimating benefits, but they depend on accurate item dimensions and order history.
9 · Measuring Whether Slotting Works
| KPI | What It Shows |
|---|---|
| Travel distance or time per pick line | The direct effect of placement on walking |
| Lines picked per labor hour | Overall picking productivity |
| Replenishment moves per day | Whether pick faces are sized appropriately |
| Pick-face stock-outs | Whether replenishment keeps up with demand |
| Pick accuracy | Whether look-alike separation and labeling are working |
| Golden-zone utilization by fast movers | Whether prime locations hold the right items |
| Location cube utilization | Whether locations are sized to the items in them |
| Ergonomic indicators | Strain-related incidents or observations in picking areas |
Comparing these before and after a slotting change, over the same order mix, isolates the effect of slotting from changes in volume.
10 · Common Slotting Mistakes
| Mistake | Consequence |
|---|---|
| Ranking by units instead of pick lines | Prime space goes to bulk movers rather than frequent visits |
| Ignoring item cube | Bulky fast movers crowd out many smaller fast movers |
| Slotting once and never revisiting | Placement drifts away from current demand |
| Re-slotting everything at once | Large labor cost and operational disruption |
| Concentrating all top items in one aisle | Congestion and waiting |
| Using inaccurate dimensions | Items do not fit, leading to overflow and exceptions |
| Ignoring weight and fragility | Damage and ergonomic strain |
| Placing look-alikes side by side | Higher mis-pick rates |
11 · Practical Considerations
The following points are commonly reviewed when operations evaluate their slotting. They are offered for information, not as a checklist.
Starting With Data Quality
Verifying item dimensions and weights, and extracting pick-line history at the right level of detail, is usually the first step.
Focusing on the Fast Movers
Because demand is often concentrated, reviewing the placement of the top-ranked items typically delivers most of the benefit.
Aligning With the Picking Method
Slotting rules that suit discrete picking may not suit batch or zone picking; the method in use shapes the rules.
Planning Around Peak
Seasonal re-slotting is commonly scheduled before peak volume arrives, when there is still time to move product without disrupting shipping.
Measuring Before and After
Recording KPIs before a change makes the effect visible and supports decisions about the next round.
⚠️ Critical Takeaway: Slotting is a cycle rather than a project: measure demand, place items, track results, and adjust as demand changes.
12 · Conclusion: Placement Is Productivity
Slotting turns order data into walking distance, reach height, and replenishment frequency. Ranking items by pick lines and cube, placing the busiest in the most accessible locations, sizing pick faces against replenishment labor, and re-slotting as demand changes together determine a large share of picking productivity, without new equipment.
Key Takeaways
| Factor | Detail |
|---|---|
| Definition | Assigning SKUs to specific locations within a given layout |
| Main Benefit | Less travel, the largest component of manual picking time |
| Key Data | Item dimensions and weight; pick lines; units; cube movement; order co-occurrence |
| Ranking Measures | Pick frequency (ABC); cube-per-order index (lower COI = more accessible location) |
| Golden Zone | Waist to shoulder height for fastest movers; NIOSH lifting equation load constant 51 lb under ideal conditions |
| Placement Rules | Fast movers near path start; heavy low and early; affinity items together; look-alikes apart; spread to avoid congestion |
| Pick-Face Sizing | Trade-off between travel and replenishment; days-of-supply and square-root allocation approaches |
| Illustrative Travel Saving | About 59% in a single-aisle example with 80/20 demand |
| Re-Slotting | Triggered by demand shifts, seasonality, new and discontinued items; weigh savings against move labor |
| KPIs | Travel per line, lines per hour, replenishments, stock-outs, accuracy, golden-zone use |
The Bottom Line
For any operation that picks orders by hand, where products sit determines much of how long picking takes and how much it costs. Treating slotting as an ongoing, data-driven process rather than a one-time setup keeps that placement aligned with demand. Businesses that would like support with fulfillment, storage, or slotting for their U.S. distribution may find it useful to work with a warehouse partner experienced in high-SKU, e-commerce, and import-driven operations.
The message is clear: placing the most frequently picked, space-efficient items in the most accessible locations, and revisiting that placement as demand changes, is one of the most direct ways to reduce picking travel, labor, and errors.
This analysis reflects established warehousing practice and research on order picking and slotting, including the cube-per-order index and forward-pick-area allocation methods described in the warehouse science literature, and NIOSH’s Revised NIOSH Lifting Equation for evaluating manual lifting tasks. Figures in examples are illustrative and do not represent any specific facility. Results of slotting changes depend on demand patterns, layout, equipment, picking method, and data quality. Organizations should consult with warehouse engineering, ergonomics, and systems professionals for guidance tailored to their specific operations.